


Stock market charts in After Effects, let's put it bluntly, are hell.
That's normal, it's an animation software, not a design software.
So all the techniques for aligning points and for mathematical calculations do not exist.
Here are 5 suggestions to get around this lack:
1. Go through Illustrator

Illustrator, on the other hand, is a software created for design. It therefore has all the tools to transform a table into a graph (whether curves, bars or point clouds).
How to proceed?
- Choose the “Graph” tool
- Draw the graph and enter the data for each element of the graph into the proposed table. Values must be in columns. You can enter the name on the x-axis in the first column, and the title of the chart on the first line.
You can also import a TSV file (the data is separated by tabs), using the first menu button proposed in the table. - Modify the graph according to your colors and fonts
- Break down the chart so you can import it into After Effects
- Separate each animatable element in the chart by clicking “Break down into layers (sequences)” in the menu at the top right of the “Layers” panel. You can also use the Overlord plugin, which sends all your Illustrator paths and transforms them into Shapes in After Effects. Overlord also sends the texts, which are also editable (which is not the case when you import an Illustrator file into After Effects)
- Import it into After Effects and animate it
The problem?
If you want to change a value in the chart, you have to redo everything from the start. EVERYTHING 😱.
2. Create the chart in After Effects
As already said, After Effects is not designed to create graphics easily, but it is possible and painful.
Here are the steps to follow:
- Create a shape layer in After Effects.
- Trace the dots with the Pen tool. Place as many points as there are values in your graph
- Use the “Create Null From Paths” script, which you can find at the end of the Window menu.
- Make sure the track is selected and click on “Points Follow Nulls”
- Null layers have been created that correspond to all of your chart points. Select all of them then go to the Align > Distribute Layers Vertically panel. The points will all be at an equal distance on the x-axis. Simply move them vertically to adjust
- Then draw the ordinates and the abscissa and match the values at the various points.
The problem?
It is very difficult to draw exact graphs, and it is very time consuming and very painstaking. And if you ever want to add or remove a column, you have to start all over again.
3. Use the new After Effects presets
Since June 2024, version 24.5 of After Effects includes new presets.
And in these presets, guess what? There are some that allow you to create charts very quickly. And what's more, they are already animated!
There are 3 presets: a line chart, a bar chart, and a radial chart (to create pie charts).
Here's how to use them:
- Open or create an After Effects composition
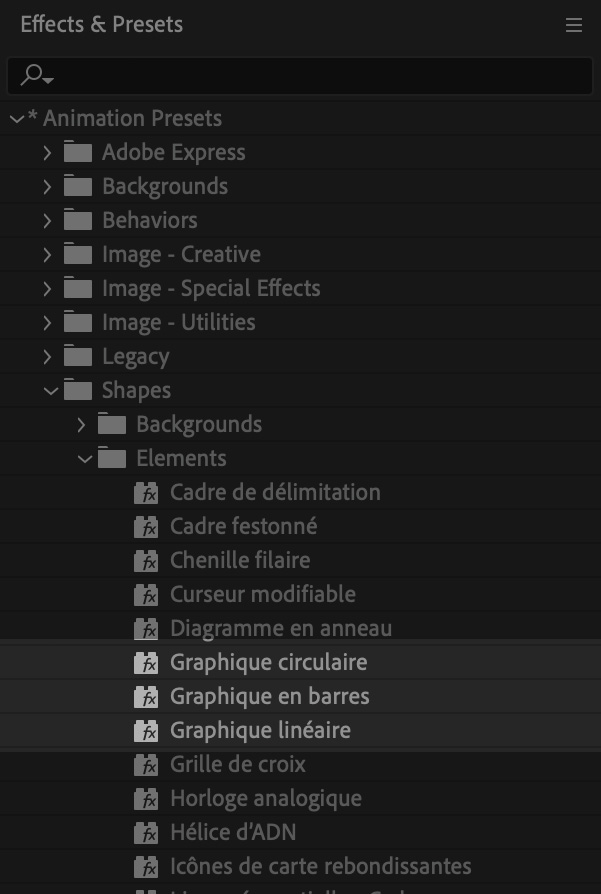
- Go to the Effects & Presets panel
- Search for “Chart” and click on the one you want
- Go forward on the timeline to visualize your graph (the first frame seems empty but it's the start of the animation)
- Change the values in the effects panel on your layer
Easy no? And I even want to say “Finally!”
The problem?
You are limited to 12 pieces of data. And you have to put everything in by hand. This type of presets is particularly useful for quick graphics without accurate data.
4. Use expressions
Expressions can sometimes save your life, and that's especially the case here.
You can place all the points on your curve using expressions. Here's how:
- Draw a shape with two points (or even a single point, but you won't see the final look until you create your expression)
- Place a null layer at the original position of your chart
- Link your shape layer to your Null layer (with the little snail - if you don't see it, you have to go to the composition panel and right-click to the right of “layer name” at the top, then choose the “parent & link” column). The coordinates entered in the expression will then be relative to the position of the Null layer.
- Add an expression to the shape layer path. Enter this expression which is a start:
//This variable is an array containing the coordinates of all the points on the graph
var pointsGraph = [
		[0,0],
		[100,100],
		[200,45],
		[300,200]
	];

//This function is used to draw the graph
createPath (pointsGraph, intangents = [], outTangents = [], isClosed = false);
From there, you can build your entire chart however you want.
The problem?
If you don't know how to use expressions, it can be very long and tedious.
Entering data into code by hand can be just as complex, but you can link it to controls, again using expressions.
This solution naturally brings us to the last one.
5. The Supergraph plugin
.png)
Expressions can be complex, and that's why plugins exist: to make your life easier.
There is one that solves all the problems mentioned in the previous proposals.
It is called Supergraph.
This is a plugin that I developed because of all the problems listed above. I wanted it to be as easy to use as possible.
Do you have a CSV with your chart names, data names, and values?
Well Supergraph turns it into a graph in one click!
Here's how to do it:
- Clean your CSV so that your decimals are separated by periods and not commas (they would conflict with the fact that the data is separated by commas)
- Open an After Effects composition.
- Import your CSV file into the composition
- While selecting it, click on the plugin button.
And that's it! You have a graph based on your values.
The beauty of this plugin? If you change your values in your CSV file, your data is automatically updated!
Even if it is animated!
Conclusion
You got it: avoid using the After Effects pen to draw your stock market charts!
Depending on your needs, you can use:
- Illustrator if your data is frozen and you are sure it won't change
- After Effects presets if you don't really have encrypted data
- Expressions if you are a code ace
- The Supergraph plugin if you want to save yourself 2 days of painstaking work
And do not hesitate to give me your feedback if you use this plugin!

Alexandre Soubrier is a freelance motion designer with a passion for illustration and animation. He created the podcast Exquises Exquisses in which he interviews author-illustrators, and produces this blog.
Contact him here or on Linked In.


